
Knowledge Component Tagging
An independent study at Carnegie Mellon University exploring how HTML5 data attributes can encode Knowledge-Learning-Instruction (KLI) framework concepts directly into eLearning content — making learner diagnosis possible at the level of individual knowledge components.
Knowledge Component Tagging: Bridging Learning Science and eLearning Standards
METALS Independent Study under Prof. Kenneth Koedinger, Carnegie Mellon University — Fall 2019
The Problem With eLearning Standards
88.5% of websites on the internet use HTML. eLearning courses are no different — HTML is the substrate on which almost all digital learning is built. And yet the standards that govern how eLearning content is packaged and tracked — SCORM chief among them — have a well-documented blind spot: they say almost nothing about learning outcomes.
Learning specialists have made this critique for years. SCORM and its successors are excellent at tagging, coding, and indexing learning objects for reuse and interoperability. They are essentially silent on whether any learning actually happened. The very definition of a “Learning Object” in these standards — a “discrete small chunk that can be used alone or dynamically assembled” — makes a learning scientist uncomfortable. We know learning does not happen in discrete, modular chunks. Chunking is a useful design technique for managing cognitive load. It is not a theory of how knowledge is acquired.
This independent study started with a simple question: what would it look like if we took the HTML elements that eLearning already runs on, and used them to encode something the learning science community actually cares about?
The KLI Framework
The theoretical grounding for this study is the Knowledge-Learning-Instruction (KLI) Framework, developed by Prof. Kenneth Koedinger, Andrew Corbett, and Charles Perfetti at CMU.
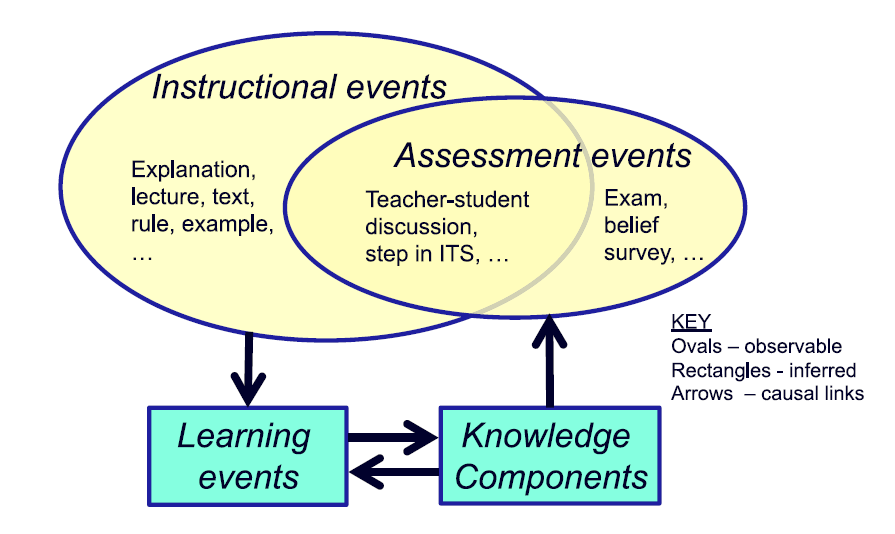
KLI defines a Knowledge Component (KC) as an acquired unit of cognitive function or structure that can be inferred from performance on a set of related tasks. The framework organises the work of learning and instruction around three event types:
- Instructional Events (IE) — observable activities that present information to the learner
- Assessment Events (AE) — observable activities that elicit performance from the learner
- Learning Events (LE) — changes in cognitive state that cannot be observed directly, but can be inferred from IE and AE data
This distinction is important. We can see what a learner reads and what they answer. We can only infer what they have actually learned. The quality of that inference depends entirely on how precisely we can trace observable events back to specific knowledge components.
Current eLearning systems collect data at the page level or the question level. KLI says we need data at the knowledge component level. This study explores whether HTML itself can be the mechanism that makes that possible.
HTML Tagging: The Mechanism
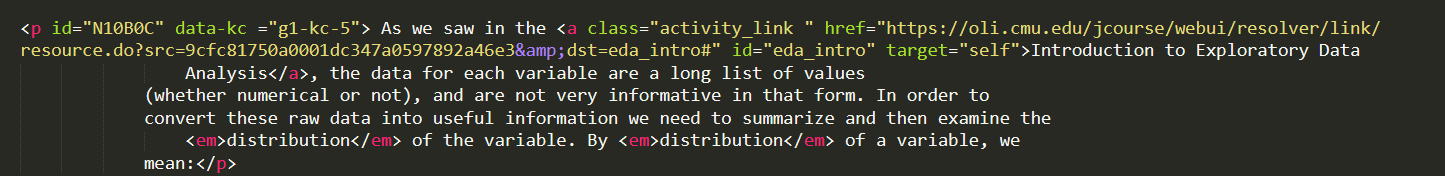
HTML5 introduced data-* attributes — a way to embed custom, application-specific data directly into HTML elements, completely ignored by the browser’s rendering engine. They are designed exactly for this purpose: attaching structured metadata to content without affecting display.
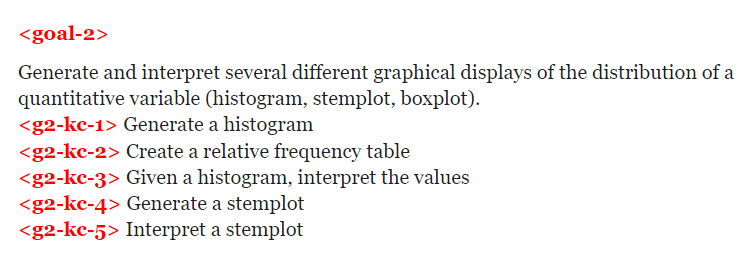
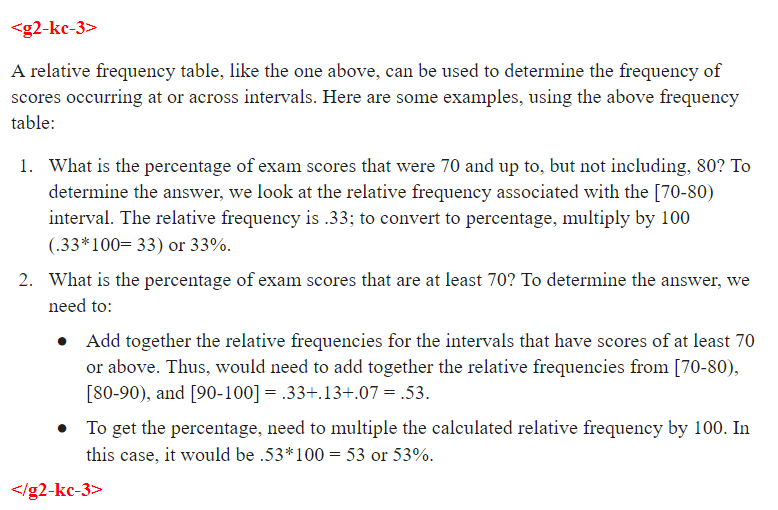
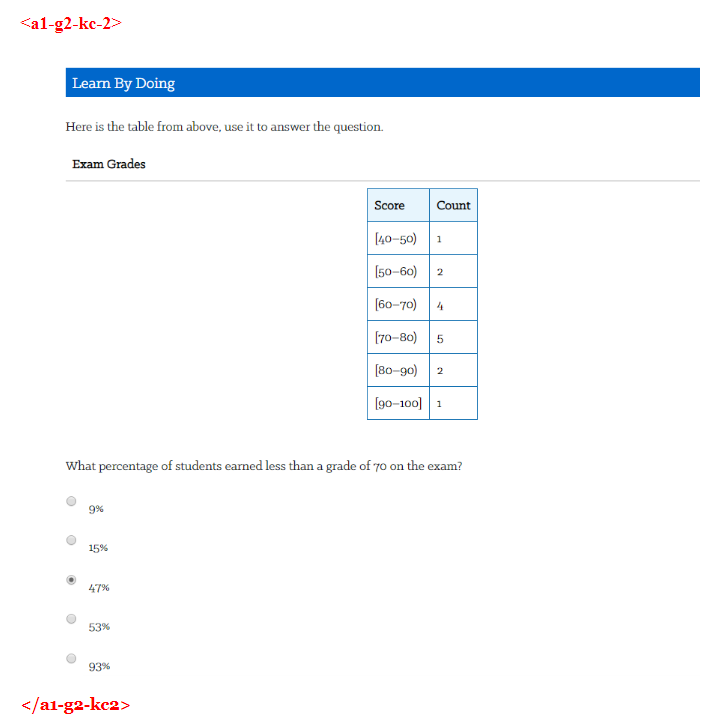
The idea this study explored: use data-* attributes to tag goals, instructional content, and assessment items with their corresponding Knowledge Component identifiers. A simple naming convention — g2-kc-1 for the first knowledge component under Goal 2, a1-g2-kc2 for the first assessment item testing the second KC under Goal 2 — creates a traceable thread from learning objective through instruction to assessment, all encoded in the markup itself.
HTML pages from an introductory Statistics course served as the practice environment. The tagging exercise covered three types of elements:
Goals and sub-goals — the learning objectives declared at the unit or lesson level, tagged to show which KCs they correspond to.
Instructional content — the explanations, examples, and worked problems that constitute the learning material, tagged to the KC they are intended to build.
Assessment items — formative questions and knowledge checks, tagged to the KC being tested so that performance data can be attributed to the right knowledge component.
Application: Diagnosis at the KC Level
Tagging is only valuable if the data it enables actually improves something. This study explored one concrete application: using KC-level log data for diagnostic purposes.
The standard critique of eLearning analytics is that they tell you what happened but not why. A student spent 30 minutes on Page 1 before answering Question 1 incorrectly. What does that tell you? Not much. Now consider the same data reframed: the student spent 15 minutes on the instructional content for KC-3 before attempting an assessment that tests KC-3, and got it wrong. That is diagnosable.
A research study on teacher needs in AI-enhanced K-12 classrooms asked teachers what superpowers they would want to do their job better. The highest-priority answer: they wanted to see students’ thought processes. KC-level data is not a superpower, but it is a step in that direction.
The Analysis
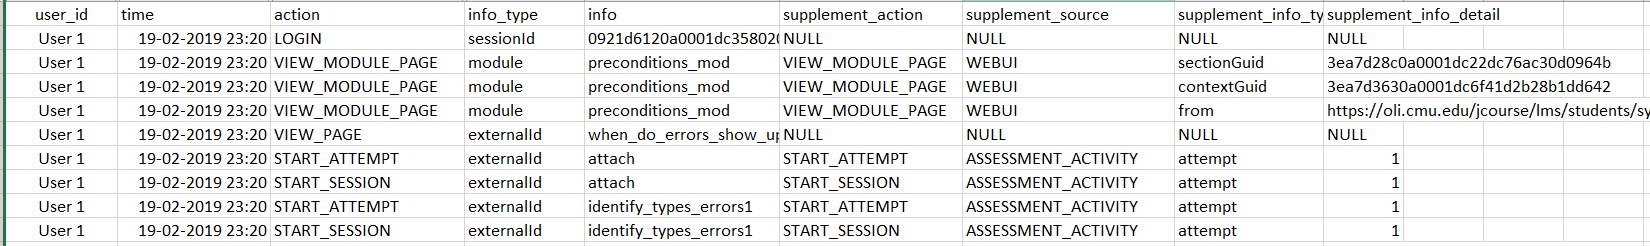
Time log data from an introductory Psychology course was used to simulate what KC-level diagnosis looks like in practice. The data had been collected with marker elements in the HTML that happened to correspond closely to individual knowledge components. Forty students, ten instructional pages, seven of which were used for analysis.
For each page, the analysis compared the time students spent reading before their first attempt at the associated question, separated by whether that first attempt was correct or incorrect.
Results
| Page | Avg. time — wrong (min) | Avg. time — correct (min) | Word count |
|---|---|---|---|
| 16 | 1.11 | 3.40 | 246 |
| 17 | 1.57 | 2.19 | 230 |
| 18 | 1.25 | 1.97 | 223 |
| 20 | 1.29 | 2.11 | 200 |
| 21 | 1.19 | 1.96 | 264 |
| 8 | 4.04 | 3.25 | 393 |
| 9 | 2.88 | 3.35 | 299 |
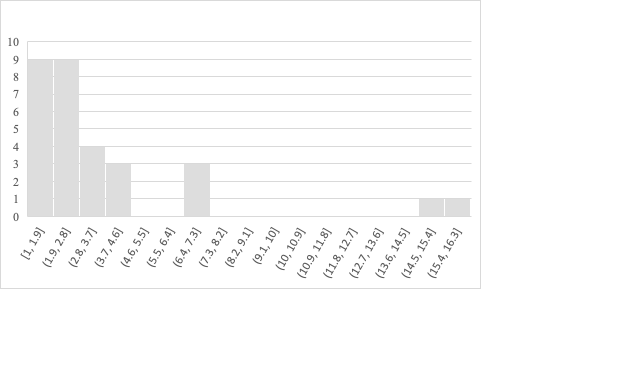
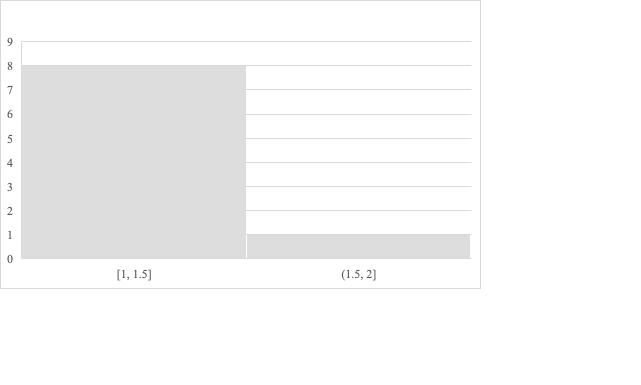
The general pattern holds: learners who spent more time reading instructional content had a higher likelihood of answering correctly. Correlation between word count and average reading time for learners who got it wrong: 0.92. For learners who got it right: 0.62.
The outlier is Page 8. It has the highest word count, and yet learners are spending more time and still getting it wrong at a higher rate than the pattern would predict. The reason becomes clear when you look at the content: Page 8 contains a graph that students need to interpret, not just text they need to read. That is a qualitatively different kind of KC — and the time data surfaces it as an anomaly worth investigating.
This is what KC-level diagnosis looks like in practice. Not just whether a student got something right, but which specific knowledge component they struggled with, and what that struggle looks like in their interaction data.
Future Directions
SCORM Meets KLI
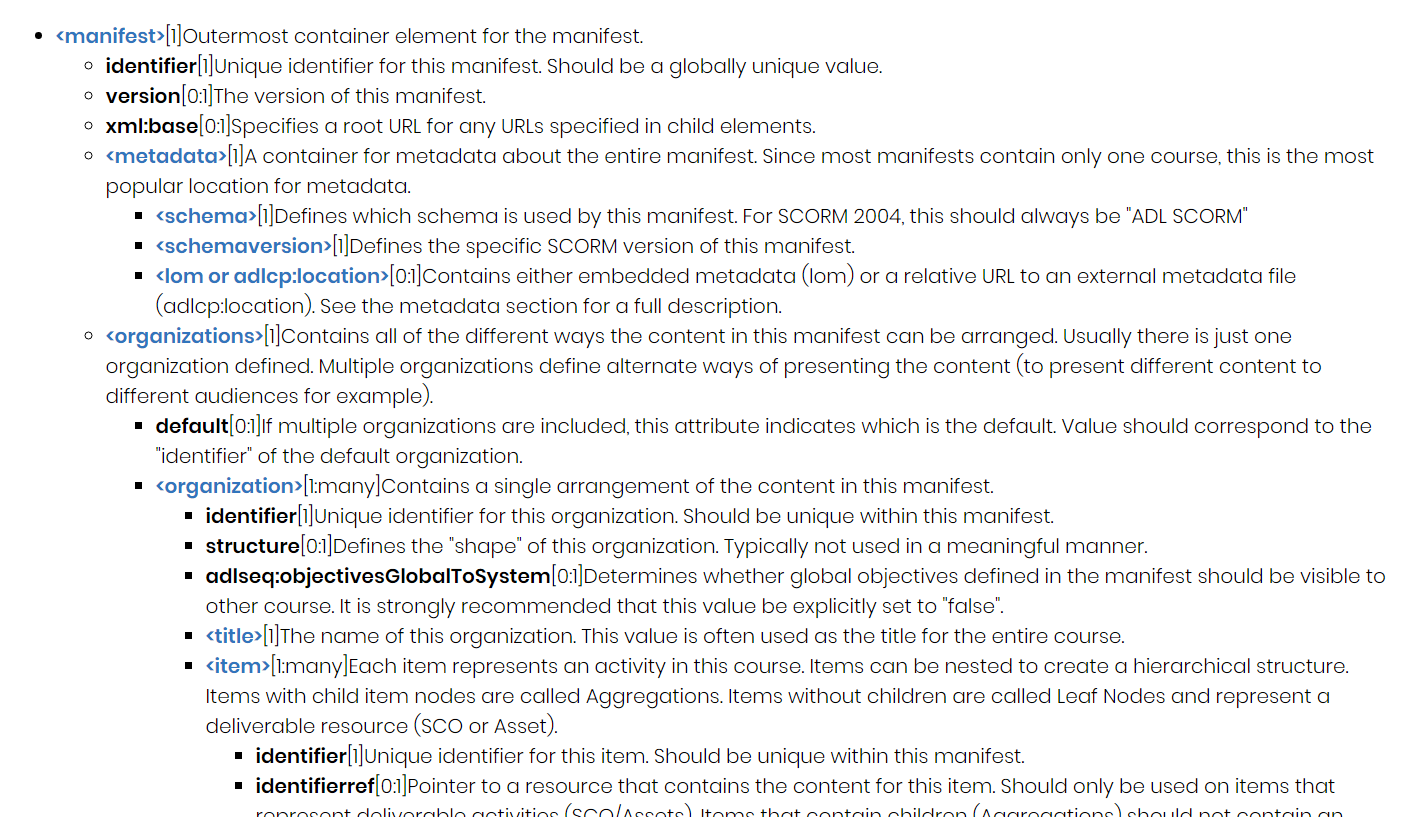
The most natural home for KC tagging at scale is the SCORM manifest file — the XML document at the heart of every SCORM-compliant course package that describes its content, structure, and sequencing. The manifest’s <item> element, which represents an individual activity in the course, is exactly where KC tags belong.
Integrating KLI Knowledge Component identifiers into the SCORM Content Packaging Specification would be a meaningful extension of the standard — one that finally gives eLearning packaging a learning-science backbone. It would also make KC-level analytics interoperable across authoring tools and LMS platforms.
Design Thinking Aid
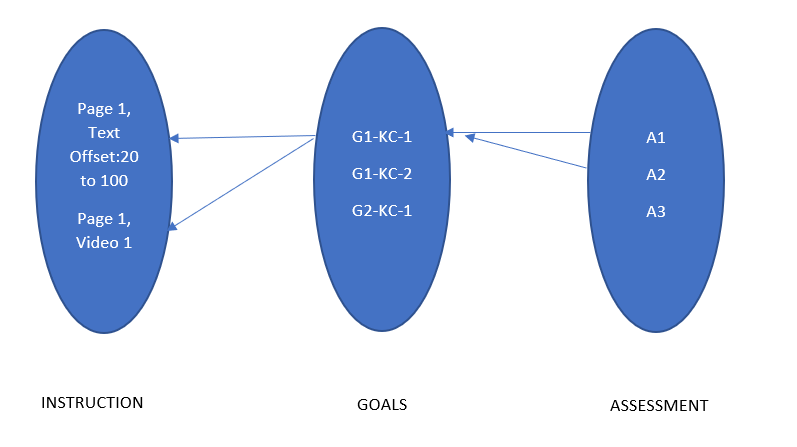
The other direction this work points toward is a visual alignment tool for course designers. Backward design and design thinking in eLearning both centre on alignment: goals, instruction, and assessment should form a coherent, traceable structure. In practice, that alignment is hard to see and hard to verify.
Once a course is tagged with KC identifiers across all three element types, the tag structure is a complete graph of the alignment: which KCs are covered by instruction, which KCs are tested by assessment, which objectives are assessed more than once. Visualising that graph gives a designer a “big picture” view of their own design and makes misalignments immediately visible — a KC tested by only one assessment item, an instructional section not mapped to any goal, an objective with no formative check.
Reflections
This study was small — a handful of HTML pages, forty students, one semester. But the question it was asking is not small.
The gap between learning science and eLearning practice is real and persistent. Researchers have known for decades what good instruction looks like at the level of knowledge components. eLearning standards have mostly ignored this, optimising for interoperability and reuse instead. The result is an industry that can tell you a student spent 47 minutes on Module 3 and passed the final quiz, but cannot tell you which knowledge components they actually acquired or why they struggled where they did.
HTML tagging using data-* attributes is not a complete solution to this. But it is an intervention at exactly the right level — it lives in the infrastructure that eLearning already runs on, requires no new tools to implement, and opens the door to analysis that the current generation of LMS platforms cannot perform.
The diagnostic application I explored here — reading time distributions as a proxy for engagement with specific KCs — is the simplest possible use of this data. The more interesting applications are ahead: adaptive sequencing that responds to KC-level mastery estimates, authoring tools that flag alignment gaps in real time, and learning analytics dashboards that speak the language of knowledge components rather than completion rates.
I am grateful to Prof. Koedinger for the guidance and the intellectual framework that made this possible to think about clearly.
Technologies: HTML5, Python (data analysis), KLI Framework, SCORM
Timeline: Fall 2019
Institution: Carnegie Mellon University — METALS Program
Supervisor: Prof. Kenneth Koedinger
This work was part of the METALS (Master’s in Educational Technology and Applied Learning Science) program at Carnegie Mellon University.